Monitoring and Reviewing Replications
You can monitor the progress of all your replications using the Replication Monitor in the Management Center. Multiple replications can run concurrently so the Replication Monitor is useful in showing which replications are running and how each replication is progressing. For historical data on performance of replications over time, use the Dashboard.

The Replication Monitor provides access to:
-
The Replication Activity Viewer for a more detailed view of performance for a specific replication.
-
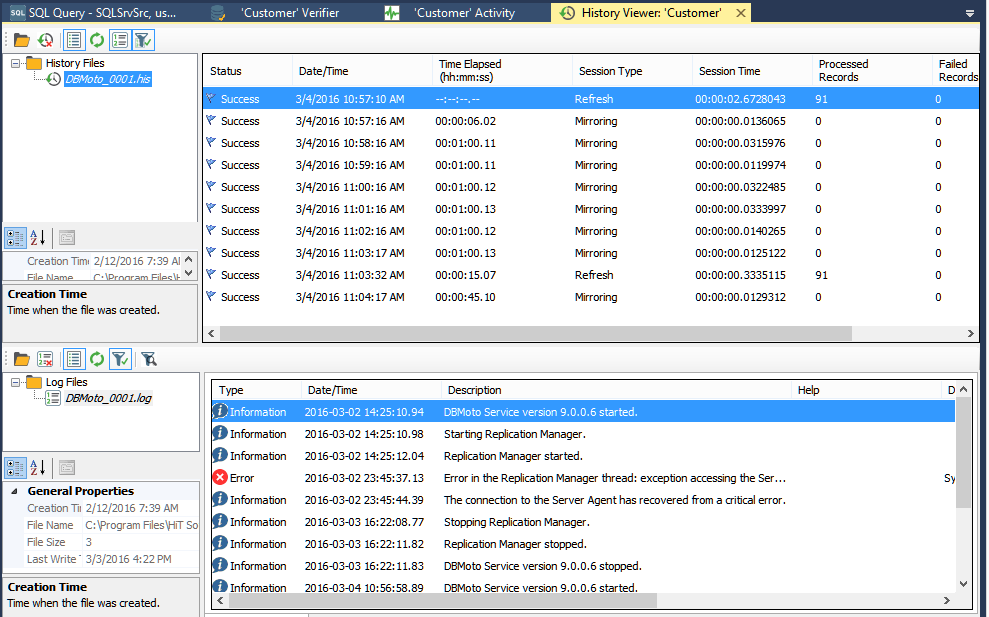
The History Viewer for a detailed account of the replication history for a specific replication.
During replication, the Replication Monitor displays the progress of the replication (percentage of records/transactions already replicated, total number of records/transactions to replicate) and the time left for a replication to be completed. You can:
-
Select a replication in the Monitor window to view the replication properties, including a history of past replication attempts.
-
Review the Records columns (Processed Records, Failed Records, Total Records) for a quick overview of replication activity
-
Scroll to the History Status column to see if the replication succeeded or failed. If it failed, use the right mouse button menu to open the History Viewer and identify errors. Note that the History Viewer only shows information on past replications when the Activate Log History option is checked in the Log tab of the Replication Agent Options dialog.
-
Review the Transaction Latency Status column to check that performance for a specific column is not lagging. A reg flag, with the label Threshold Warning indicates that records are not being processed
To identify where a replication failed:
-
Select a replication in the Metadata Explorer, Replication Browser or Replication Monitor.
-
Choose Show History from the right mouse button menu.

The History Viewer tab allows you to explore completed replication intervals and even view the log to explore errors and warnings associated with the replication interval.
-
Examine the replication intervals for errors in the upper pane of the History Viewer.
-
Select the replication interval that shows errors to display log messages in the lower pane of the History Viewer.
This pane provides the complete functionality of the Log Viewer. You can double-click a specific message to find out more about it, or you can click Show
Filter Settings to type in a specific search pattern for log
messages.
Show
Filter Settings to type in a specific search pattern for log
messages. -
If available, check the Replication tab for a table with the records which were not replicated.
-
Fix the errors.
You may need to modify mappings in the Replication Properties dialog, or make changes in the source or target database tables. -
Go back to the Replication Monitor to clear the History Status flag ready for future replications.
-
Try running the replication again to see that errors have been resolved.
Related Topics
Replication Monitor
Log Viewer
History Viewer
Replication Agent Options Dialog
Replication Activity Viewer